

Formulaic Density by Sura Chart
The Formulaic Density by Sura chart (found under the ‘Charts’ menu and then under ‘Formulae’) shows you what percentage of the words in each sura form part of a formulaic phrase — or what in Oral Traditional studies is termed the ‘formulaic density’ of the sura.
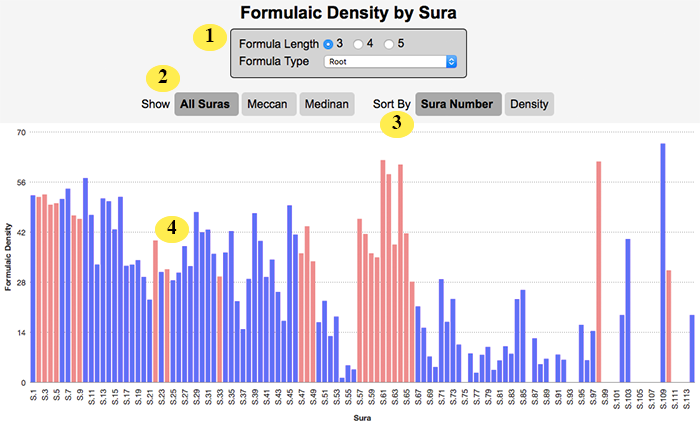
| 1 | Formula Type and Length to Show. This allows you to customise the type of formulae that Qur’an Tools counts and shows in the chart below. (The length is the number of Arabic words in a formula; the type allows you to choose from any of the three formula types that Qur’an Tools understands, or to choose ‘All Formula Types’ which means the chart will count what percentage of the words in each sura are part of any type of formula. |
| 2 | Suras to Show. By clicking the buttons, you can choose whether to plot every sura, just Meccan suras, or just Medinan suras on the chart. |
| 3 | Sort By. You can either sort your chart by sura (so sura 1 is drawn first and sura 114 last), or you can sort your chart by formulaic density (meaning suras with a higher formulaic density will appear first). |
| 4 | Chart Columns. Point your mouse at a column and Qur’an Tools will show you a tooltip with the exact value in it. You can also click a column to “drill down” — Qur’an Tools will open the verse browser and show the sura you have clicked on, with every formula of the type you are charting helpfully coloured blue in the text. |
TIP
If you would like to see the formulaic density of the entire Qur’an (rather than of individual suras, as the chart above shows), simply click on ‘Formulae’ on the Qur’an Tools main menu bar, then choose ‘Formulaic Density Summary Table’.